SAFARI Sample Output Files
These files are generally tab separated. The location and name of these files is specified via the -o argument, or is the same as for the input files if not specified. For the purpose of readability, the tab characters in the below files have been replaced with two spaces.
Production of The .spec file and The .data file can be controlled via using <type> on line 44 of the main input file Main Input File. This option is a bitmask, with the following flags:
1 - Enable The .data file output
2 - Enable The .spec file output
These can be combined to produce both files, where 3 will do this.
The .data file
This is the primary data output file, it will contain the final results of the trajectories, though normally will only contain the detectable particles, this can be adjusted via settings in the input files.
Here is a sample .data file.
1X0  Y0  Zm  E  THETA  PHI  ion index  weight  max_n  min_r  steps  Max Error  total time
22.558862  2.027624  0.856  180.633  21.042  -3.093  80002  1.000  12  0.910  224  0.185  2.693
30.908598  0.526922  0.780  213.365  50.721  -0.215  60003  1.000  12  1.068  294  0.027  3.315
42.400500  3.763921  -3.583  166.084  29.615  -2.379  64494  1.000  12  1.051  764  0.050  6.353
51.174906  2.147880  -2.809  18.778  17.251  -4.131  24671  1.000  12  0.947  1209  0.372  15.367
61.164306  3.453702  0.439  196.119  24.137  -4.210  24683  1.000  12  1.081  394  0.038  3.423
The columns in this file are as follows:
X0- the initial, target x coordinate for the run
Y0- the initial, target y coordinate for the run
Zm- the minimum z-coordinate of the projectile during the run
E- the final kinetic energy of the projectile
THETA- the exit angle theta of the projectile
PHI- the exit angle phi of the projectile
ion index- a unique index for this particular projectile
weight- In adaptive grid mode, this is the grid depth, otherwise is just 1
max_n- Maximum number of particles considered for interaction for this projectile
min_r- Minimum distance this projectile got to another particle
steps- Total number of integration steps required, if these numbers are significantly less than the maximum number of steps, that value should probably be reduced in the Main Input File
Max Error- Maximum change in energy encountered by the projectile during any timestep
total time- Total trajctory time in SAFARI time units (SAFARI Units)
The .spec file
This file contains binned collections of the final detector positions of the various particles detected. This file starts with a header describing the energy and angle ranges contained in the file. It is then separated into blocks for each energy bin. For each block, there is a table of number of detections per angular bin. Each table has a header row and column with an approximate angle set for those bins, a more precise angle can be obtained from the information in the header.
A sample of the header is below:
--------------------------------------------------------

SAFARI Spectra File, Ranges in this file are as follows:
Energy range: 0.50 to 250.00 eV
Theta range: 0.00 to 90.00 Degrees
Phi range: -15.00 to 15.00 Degrees

This file is split into blocks for each energy section
Each block contains a header row and column, which states
the theta and phi angles for those blocks respectively

Total Counts: 7800
Largest Bin: 5
    (227.50eV, Theta: 73.0 Degrees, Phi: 12.3 Degrees)

--------------------------------------------------------
This header contains the various ranges involved, as well as the total number of counts represented in the detector, as well as the bin containing the highest number of detections.
The .spec file can be processed more easily for generating spectra than The .data file, the size of this file also does not depend strongly on the number of trajectories simulated, so it can be used more easily for calibrating energies, angles, image charges, etc. If The .data file output is disabled, a run can be set which generates this file for an arbitrarily long time, until there is a significant number of detections per bin, without consuming infeasibly large amounts of disk space.
The .dbug file
This file will contain general information about the run, and is to be used for assiting with configuration of some of the runtime parameters, such as error thresholds, etc.
The file starts with a trimmed copy of the input file, similar to the one found at Compact Input File. It is then followed by some messages about runtime, and then some statistics about the various exit conditions encountered. It also included runtime information.
Here is a sample .dbug file.
 1Loading Info From: sample_ag
 2
 3250.0 45.0 0.00 22.989 Na
 40.5 250 2.5 0.5
 51 f
 645.0 45 15.0
 71e-08 10.0
 80.3 0.0 1e-06
 912
10t
115.0
124000
1310.0 0.002
140.0 0.0003
152 100
16100
170 0.040786 4.0786
180 0.040786 4.0786
19666 2
205.0 5.0
214 1 0
224153.6 3.625 27017.57 7.286
232 0
241.26 2.0
25300.0 0.9436337324 1
26f
27-1.5 8.1
284.0786 4.0786 4.0786
294
301.0 1.0 1.0 1
311.0 0.5 0.5 1
320.5 1.0 0.5 1
330.5 0.5 1.0 1
341
35196.967 79 Au
365.0 5.0 5.0
37t 1.5 10 2
380 0 1 f 1 1 1
390 0
40
41Loaded SAFIO
42Loaded Settings, Initializing Potentials and Temperatures
43Initializing Temperature
44Initialized Potentials, Building Lattice
45built lattice
46Printing Lattice
47Running Adaptive Grid
48Total Out of Phi  (-5): 669979
49Total Trapped     (-10): 0
50Total Stuck       (-100): 0
51Total Buried      (-200): 221504
52Total Froze       (-300): 175983
53Total OOB         (-400): 1534
54Total Errored     (-500): 0
55Total Intersected (-600): 0
56Total Out of Mask: 0
57
58Total number particles: 2129529
59Time per particle: 1.875ms
60
61Total Runtime: 3993s
Important to note in this file, are the error/exit conditions listed near the bottom (Lines 48-56 in the sample). These can be used for adjusting various input parameters for optimizing simulation runtime. The relevant exit conditions for adjusting input parameters are as follows:
Froze- If this number is significant, you might consider increasing the maximum allowed timestepsOOB- This is how many left the edge of the crystal, if this is significant, you should increase the size of the generated crystal
If the runtimes are unacceptably large, you can consider decreasing the number of allowed timesteps until the ratio which return as Froze becomes almost significant, likewise if memory use is too large, you can decrease the generated crystal size until the ratio returining OOB becomes significant.
Exit conditions related to particles not being detectable are as follows:
Out of Phi- This particle was not in plane with the detector and incoming beam, the thresholds on this can be set based on the detector window settings, on line 53 of input fileTrapped- The particle had left the surface, but was then re-trapped by the image potentialStuck- The particle went below the Stuck Energy threshold (See first value on line 219 of input file)Buried- The particle went more than the Buried Threshold below the surface (Second value on line 219 of the same file)
The remaining exit conditions are as follows:
Errored- The particle encountered a large discontinuity in energyIntersected- The particle intersected with another atom
The .crys file
After generating or loading the lattice, a .crys file will be generated with the initial, 0K state of the lattice. This file can be re-named to a .crys_in file for providing as an external lattice if needed.
This file is of identical format to the .crys_in files, but here is a sample anyway:
 10.000000  0.000000  0.000000  29.000000  63.546000
 20.000000  1.300000  -2.600000  29.000000  63.546000
 30.000000  -1.300000  -2.600000  29.000000  63.546000
 40.000000  2.600000  -5.200000  29.000000  63.546000
 50.000000  0.000000  -5.200000  29.000000  63.546000
 60.000000  -2.600000  -5.200000  29.000000  63.546000
 70.000000  3.900000  -7.800000  29.000000  63.546000
 80.000000  1.300000  -7.800000  29.000000  63.546000
 90.000000  -1.300000  -7.800000  29.000000  63.546000
100.000000  -3.900000  -7.800000  29.000000  63.546000
There is also a .xyz formatted version of the file generated, for use in external visualizers such as VMD3. This file is suffixed with .crys.xyz, to separate it from the Single Shot mode files referenced below.
The corresponding such file to the above .crys file is below:
 110
 2
 3Cu  0.000000  0.000000  0.000000
 4Cu  0.000000  1.300000  -2.600000
 5Cu  0.000000  -1.300000  -2.600000
 6Cu  0.000000  2.600000  -5.200000
 7Cu  0.000000  0.000000  -5.200000
 8Cu  0.000000  -2.600000  -5.200000
 9Cu  0.000000  3.900000  -7.800000
10Cu  0.000000  1.300000  -7.800000
11Cu  0.000000  -1.300000  -7.800000
12Cu  0.000000  -3.900000  -7.800000
The .sptr file
The inter-lattice force type mentioned around line 174 of input files is a bitmask field. In the case where 16 (and montecarlo mode) or 32 is present in this bitmask, then SAFARI also produces a file containing surface atoms which have sputtered off. A sample such file is as follows:
1X0  Y0  Zm  E  THETA  PHI  ion index  ion err flag  max_n  min_r  steps  Max Error  total time
25.422050  1.807350  0.000  1.069  88.375  0.574  60  0.000  0  2.121  5876  0.008  47.775
31.807350  1.807350  0.000  2.189  15.694  148.197  60  0.000  0  0.935  5876  0.008  47.775
43.614700  0.000000  0.000  0.508  78.522  2.583  0  -200.000  0  1.149  4637  0.048  36.343
50.000000  0.000000  0.000  8.899  38.506  -175.292  44  0.000  0  0.942  5771  0.007  46.643
67.229400  0.000000  0.000  0.023  74.856  6.367  64  -200.000  0  2.111  6040  0.078  45.892
75.422050  5.422050  0.000  1.581  81.854  89.198  24  0.000  0  1.967  6831  0.007  58.582
83.614700  3.614700  0.000  0.957  24.905  153.323  24  0.000  0  0.934  6831  0.007  58.582
95.422050  3.614700  -1.807  2.110  27.856  82.301  24  0.000  0  1.356  6831  0.007  58.582
The columns here are similar to .data columns, with a few differences as noted below:
X0- the 0 temperature x coordinate for the atom
Y0- the 0 temperature y coordinate for the atom
Zm- the 0 temperature z coordinate for the atom
E- the final kinetic energy of the atom
THETA- the exit angle theta of the atom
PHI- the exit angle phi of the atom
ion index- a unique index for the projectile which produced this sputter
weight- The error flag for the projectile (see dbug flags)
max_n- Maximum number of particles considered for interaction for this atom
min_r- Minimum distance this atom got to another particle
steps- Total number of integration steps for the ion that caused the sputter
Max Error- Maximum change in energy encountered by the projectile during any timestep
total time- Total trajctory time in SAFARI time units for the projectile (SAFARI Units)
Single Shot Mode Files
In Single Shot Mode, two additional files are generated, the .traj file, and the .xyz file.
The .traj file
The primary output file from single shot mod is the .traj file. This file contains a snapshot of the state of the projectile particle at each timestep of the simulation. This includes position, momentum, energy, timestep, and computed error.
Here is a sample of such a file:
1x  y  z  px  py  pz  t  n  T  V  E  near  dt  dr_max
20.000000  0.000000  10.000000  0.000  0.000  -438.140  0.000000  0  1500.000  0.000  1500.000  0  0.100000  0.000
30.000000  0.000000  9.931529  0.000  -0.000  -438.140  0.010000  1  1500.000  0.000  1500.000  10  0.010000  0.000
4... Many omitted lines
50.000000  0.000000  -1.716291  0.000  0.000  -2.566  49.297234  5999  0.051  0.000  0.051  10  0.010000  0.000
60.000000  0.000000  -1.716692  0.000  0.000  -2.566  49.307234  6000  0.051  0.000  0.051  10  0.010000  0.000
The various columns in this file can be used to generate plots, which can then be used to characterize the trajectories, this gives basic information as to the number of significant interactions, how quickly the energy is lost, etc, during the simulation.
The columns in this file are as follows:
x y z- These three columns are the position of the projectilepx py pz- These three are the momentum of the projectilet- This is the total trajctory time so far (see SAFARI Units)n- The current step, this is generally just an index of rows in the tableT- The kinetic energy of the projectileV- The total potential that the projectile is currently inE- T + V, the total energy of the projectilenear- Number of lattice sites being considered for interactiondt- Current timestep for the projectiledr_max- maximum positional error encountered so far
Plots of T vs t or V vs t can be used to gauge a general indication of the number of significant collisions which occur, as well as to get an indication of how well approximations such as the Single Binary Collision Approximation (SBCA) would apply to that particular trajectory type.
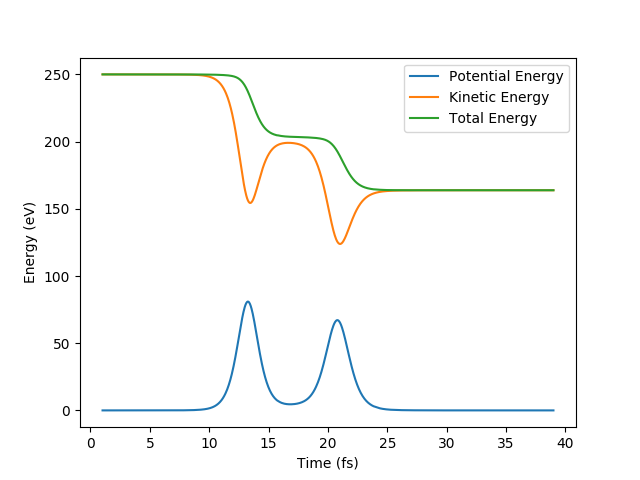
Figure 10 An example of a plot of T, V, and E vs t, where the time has be converted to fs. This shows two distinct collisions of the projectile.
The .xyz files
This file is produced for the purpose of generating videos of the trajctory via external software such as VMD. A sample of such a file is below:
 111
 20
 3Na  0.000  0.000  10.000  0.000  0.000  -438.140  63.989  0  1
 4Cu  0.000  0.000  0.000  0.000  0.000  0.000  63.546  1  0
 5Cu  0.000  1.300  -2.600  0.000  0.000  0.000  63.546  2  0
 6Cu  0.000  -1.300  -2.600  0.000  0.000  0.000  63.546  3  0
 7Cu  0.000  2.600  -5.200  0.000  0.000  0.000  63.546  4  0
 8Cu  0.000  0.000  -5.200  0.000  0.000  0.000  63.546  5  0
 9Cu  0.000  -2.600  -5.200  0.000  0.000  0.000  63.546  6  0
10Cu  0.000  3.900  -7.800  0.000  0.000  0.000  63.546  7  0
11Cu  0.000  1.300  -7.800  0.000  0.000  0.000  63.546  8  0
12Cu  0.000  -1.300  -7.800  0.000  0.000  0.000  63.546  9  0
13Cu  0.000  -3.900  -7.800  0.000  0.000  0.000  63.546  10  0
1411
150.01
16Na  0.000  0.000  9.932  0.000  -0.000  -438.140  63.989  0  1
17Cu  0.000  0.000  -0.000  0.000  0.000  -0.008  63.546  1  1
18Cu  0.000  1.300  -2.600  0.000  -0.008  -0.008  63.546  2  1
19Cu  0.000  -1.300  -2.600  0.000  0.008  -0.008  63.546  3  1
20Cu  0.000  2.600  -5.200  0.000  -0.008  -0.008  63.546  4  1
21Cu  0.000  0.000  -5.200  0.000  0.000  -0.000  63.546  5  1
22Cu  0.000  -2.600  -5.200  0.000  0.008  -0.008  63.546  6  1
23Cu  0.000  3.900  -7.800  0.000  -0.008  0.008  63.546  7  1
24Cu  0.000  1.300  -7.800  0.000  -0.001  0.016  63.546  8  1
25Cu  0.000  -1.300  -7.800  0.000  0.001  0.016  63.546  9  1
26Cu  0.000  -3.900  -7.800  0.000  0.008  0.008  63.546  10  1
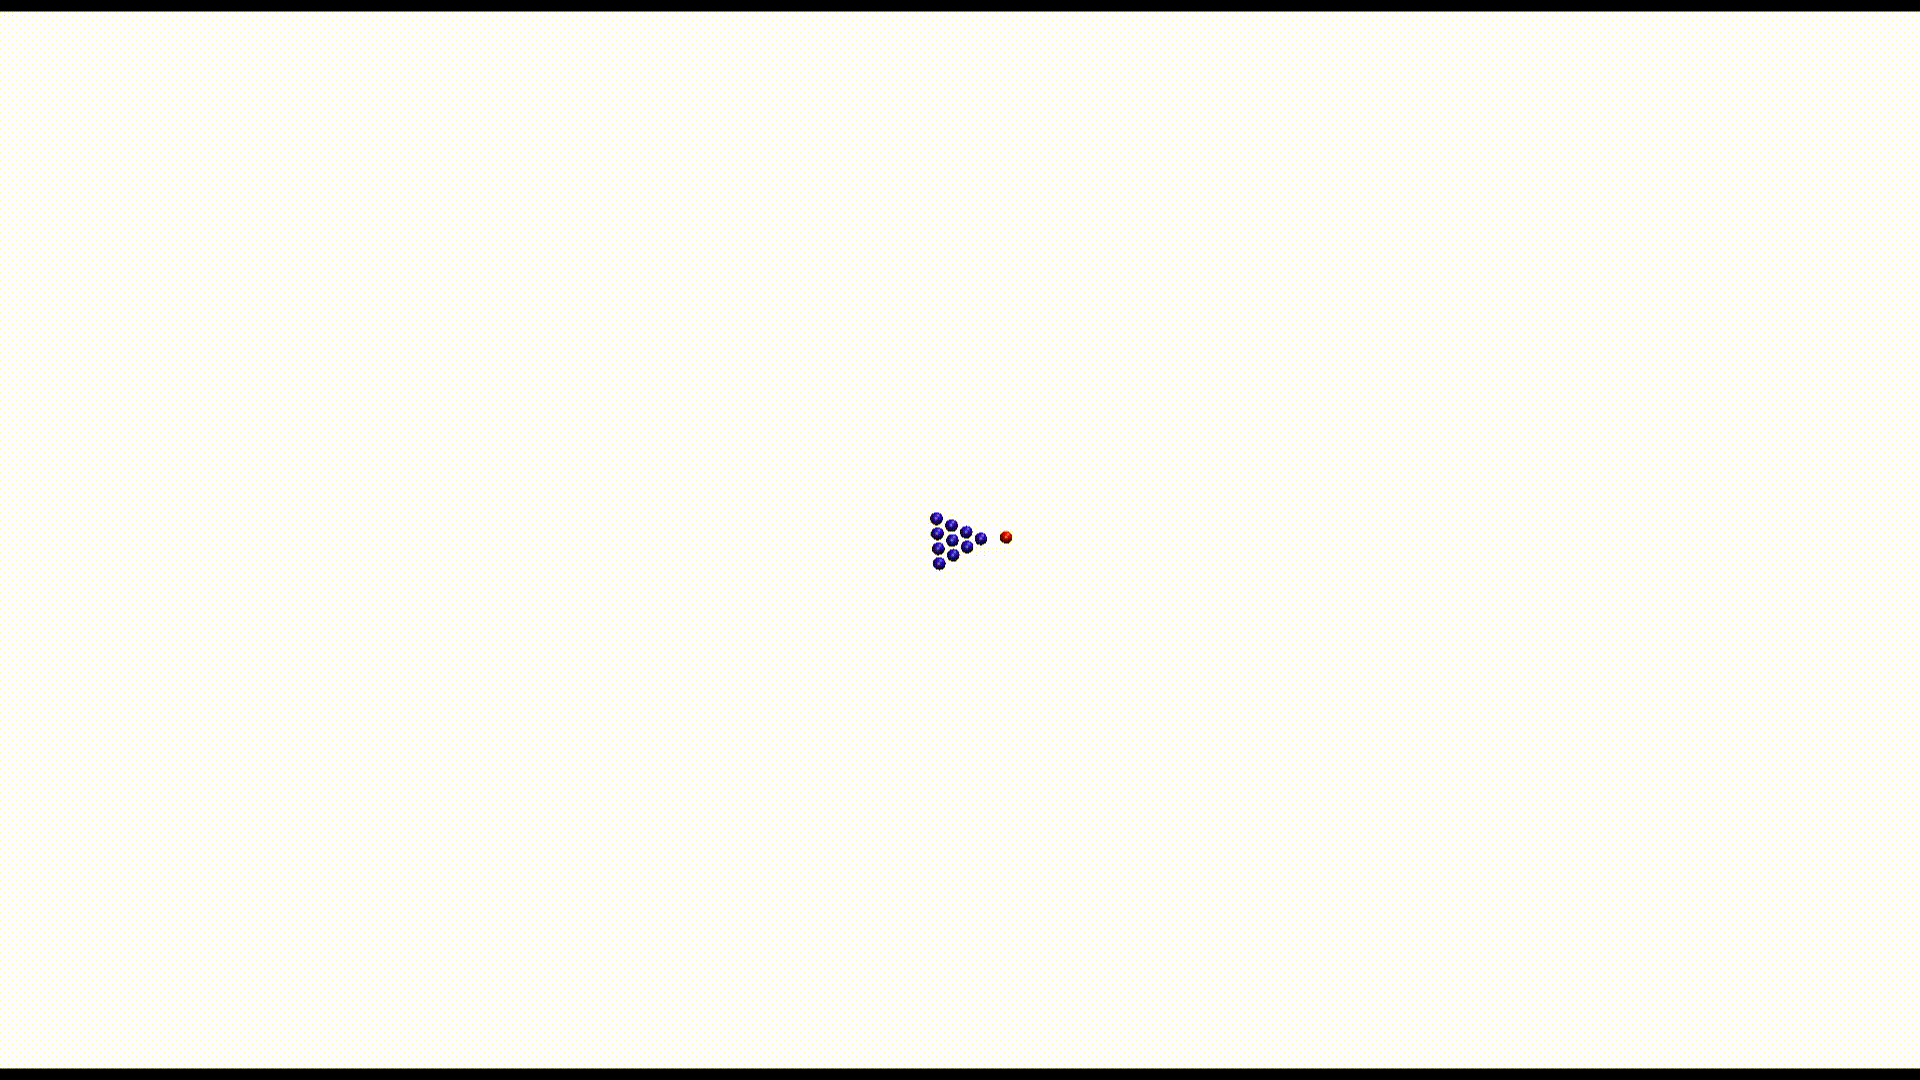
Here is a sample of a video produced by VMD from an output .xyz file from a single shot run.
Some additions to this file
The timestamp for the frame is added as the “comment” line
Additional columns are added to this file from the standard files:
x-component of momentum
y-component of momentum
z-component of momentum
Mass of the particle (useful for isotope considerations)
Index of the particle (used to sort/cleanup xyz afterwards)
Interaction status, this is 0 or 1, depending on if the particle is in interaction range of the projectile